User Guide
This guide provides a quick overview to get started with BharatFinTrack.
Verify Installation
Ensure a successful installation by running the following commands.
import BharatFinTrack
Equity Index Base Parameters
Save the MultiIndex DataFrame containing the base parameters of equity indices to an Excel file.
nse_product = BharatFinTrack.NSEProduct()

nse_product.equity_base_parameter_midf(
    excel_file=r'C:\Users\Username\Folder\base_parameter.xlsx'
)
Download Data
A brief overview of features related to data downloading. Start by instantiating the classes.
nse_pri = BharatFinTrack.NSEIndex()  # Price Return Index
nse_tri = BharatFinTrack.NSETRI()  # Total Return Index
nps = BharatFinTrack.NPS()  # National Pension Scheme
Historical Data
Download historical daily TRI data for the NIFTY 50 index. Currently, the function supports only equity indices.
# Downloading daily closing TRI data up to a specified date
nse_tri.download_daily_data(
    index='NIFTY 50',
    start_date=None,
    end_date='31-Mar-2024',
    csv_file=r"C:\Users\Username\Folder\NIFTY 50.csv",
)

# Using the same CSV file to update daily closing TRI data to the present date
nse_tri.update_daily_data(
    index='NIFTY 50',
    csv_file=r"C:\Users\Username\Folder\NIFTY 50.csv"
)
Downloads historical daily Net Asset Value (NAV) data for a specific Pension Fund Manager and scheme identifier.
nps.scheme_historical_nav(
    pfm_name='HDFC',
    scheme_id='SM008019',
    csv_file=r"C:\Users\Username\Folder\SM008019.csv"
)
TRI Closing Values
Download the closing TRI values for all equity indices. These values are not updated daily on the website.
It is recommended to run this function at night when web traffic is lower, as it sends multiple requests to retrieve the required data.
nse_tri.download_equity_close(
    csv_file=r"C:\Users\Username\Folder\TRI_closing.csv"
)
PRI Closing Summary
Download the daily summary report of PRI closing values, published daily
on the Nifty Indices Reports, and save
it as a CSV file.
nse_pri.download_equity_close(
    csv_file=r"C:\Users\Username\Folder\PRI_closing.csv"
)
CAGR and SIP
A brief overview of features related to Compound Annual Growth Rate (CAGR) and Systematic Investment Plan (SIP). Start by instantiating the classes.
cagr = BharatFinTrack.CAGR()
sip = BharatFinTrack.SIP()
CAGR Summary Since Inception
The following methods can be used to compute CAGR (%) of all equity indices since inception. The resulting CAGR (%) values are used to sort the equity indices in descending order, either overall or within each category.
# Sort equity indices by CAGR (%) since launch
cagr.sort_since_inception(
    csv_file=r"C:\Users\Username\Folder\TRI_closing.csv",
    excel_file=r"C:\Users\Username\Folder\sort_cagr.xlsx"
)

# Sort equity indices by CAGR (%) since launch within each category
cagr.sort_since_inception(
    csv_file=r"C:\Users\Username\Folder\TRI_closing.csv",
    within_category=True,
    excel_file=r"C:\Users\Username\Folder\sort_cagr_within_category.xlsx",
)
Year-wise SIP Growth
Compute the year-wise SIP returns for a fixed monthly contribution to a specified asset (either a TRI index or an NPS scheme).
sip.yearly_return(
    csv_file=r"C:\Users\Username\Folder\NIFTY 50.csv",
    invest=1000,
    excel_file=r"C:\Users\Username\Folder\NIFTY 50_SIP.xlsx",
)
Year-wise SIP and CAGR Comparison
This section compares the year-wise XIRR (%) and growth multiples (X) of a fixed monthly SIP investment, along with the year-wise CAGR (%) and growth multiples of a one-time investment across selected assets.
The required data are sourced from CSV files generated in the Historical TRI Daily Data section. Ensure that all input CSV files are stored in the designated folder, with each file named as {index}.csv to match the index names provided in the list. The output highlights the highest growth cells in green-yellow and the lowest growth cells in sandy brown.
index_list = [
    'NIFTY 50',
    'NIFTY ALPHA 50',
    'NIFTY MIDCAP150 MOMENTUM 50',
    'NIFTY500 MOMENTUM 50'
]

# SIP comparison
sip.compare_performances(
    indices=index_list,
    dir_path=r"C:\Users\Username\Folder",
    excel_file=r"C:\Users\Username\Folder\compare_sip.xlsx"
)

# CAGR comparison
cagr.compare_performance(
    indices=index_list,
    dir_path=r"C:\Users\Username\Folder",
    excel_file=r"C:\Users\Username\Folder\compare_cagr.xlsx"
)
Correction and Recovery Cycles
This functionality identifies key turning points in an index’s historical values based on consecutive corrections and recoveries. It applies minimum gain and multiplier filters to analyze the frequency and behavior of these movements over time.
analyzer = BharatFinTrack.Analyzer()

analyzer.correction_recovery_cycles(
    csv_file=r"C:\Users\Username\Folder\NIFTY 50.csv",
    excel_file=r"C:\Users\Username\Folder\NIFTY 50_correction_recovery.xlsx"
)
Visualization
A brief overview of features related to data visualization. Start by instantiating the class.
visual = BharatFinTrack.Visual()
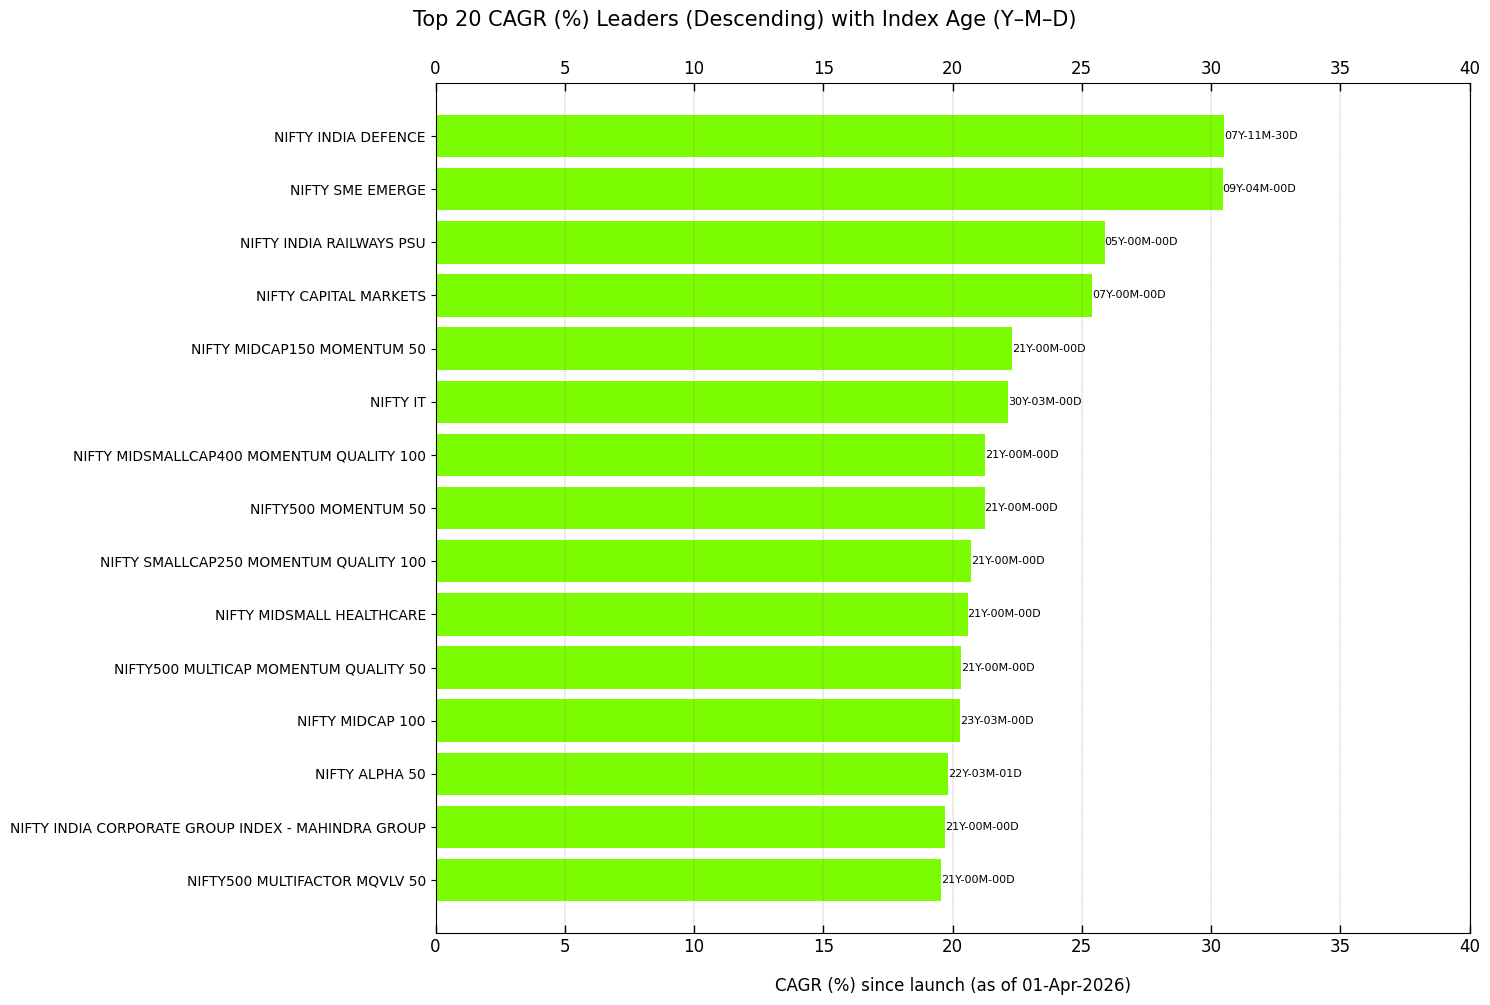
CAGR Leaders
This section presents bar plots of equity index CAGR (%) in descending order, either overall or within each category.
The following code plots the top 15 equity indices by overall TRI CAGR (%).
visual.cagr_leaders(
    excel_file=r"C:\Users\Username\Folder\sort_cagr.xlsx",
    figure_file=r"C:\Users\Username\Folder\sort_cagr.png"
)
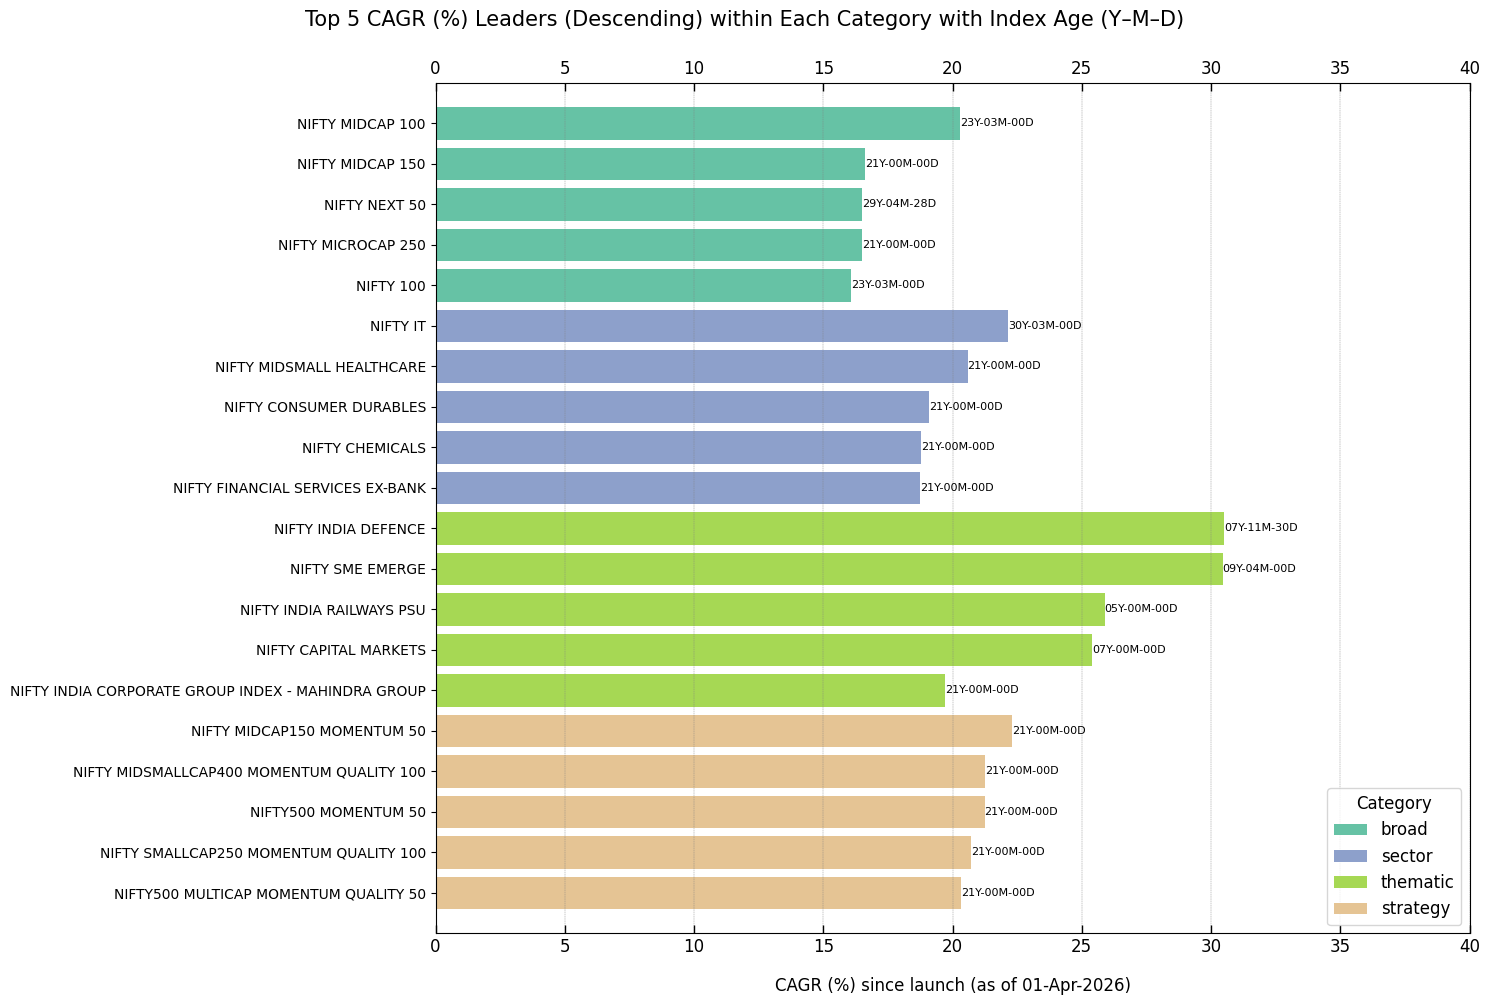
The following code plots the top five equity indices by TRI CAGR (%) within each category since launch.
visual.cagr_leaders_by_category(
    excel_file=r"C:\Users\Username\Folder\sort_cagr_within_category.xlsx",
    figure_file=r"C:\Users\Username\Folder\sort_cagr_within_category.png"
)
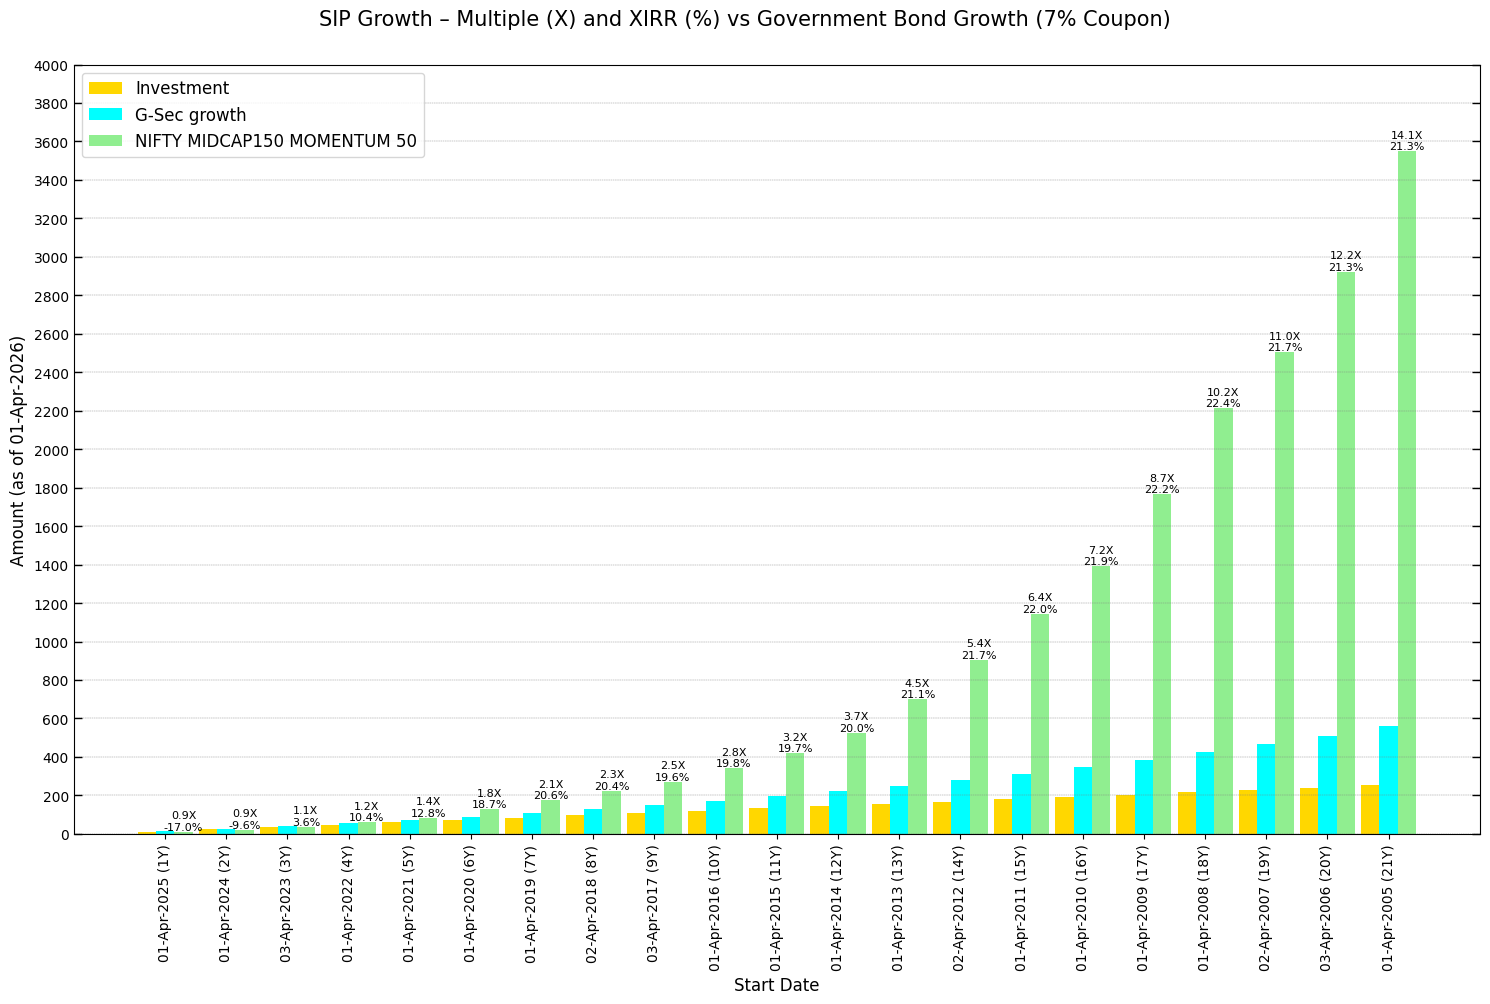
SIP Comparison with Government Securities
The following code displays a bar plot comparing SIP returns over time for the TRI data of an index and government securities with an assumed yield.
visual.compare_sip_to_bond_benchmark(
    excel_file=r"C:\Users\Username\Folder\NIFTY MIDCAP150 MOMENTUM 50_SIP.xlsx",
    figure_file=r"C:\Users\Username\Folder\sip_growth_vs_bond_benchmark.png"
)
The resulting plot will resemble the example shown below.
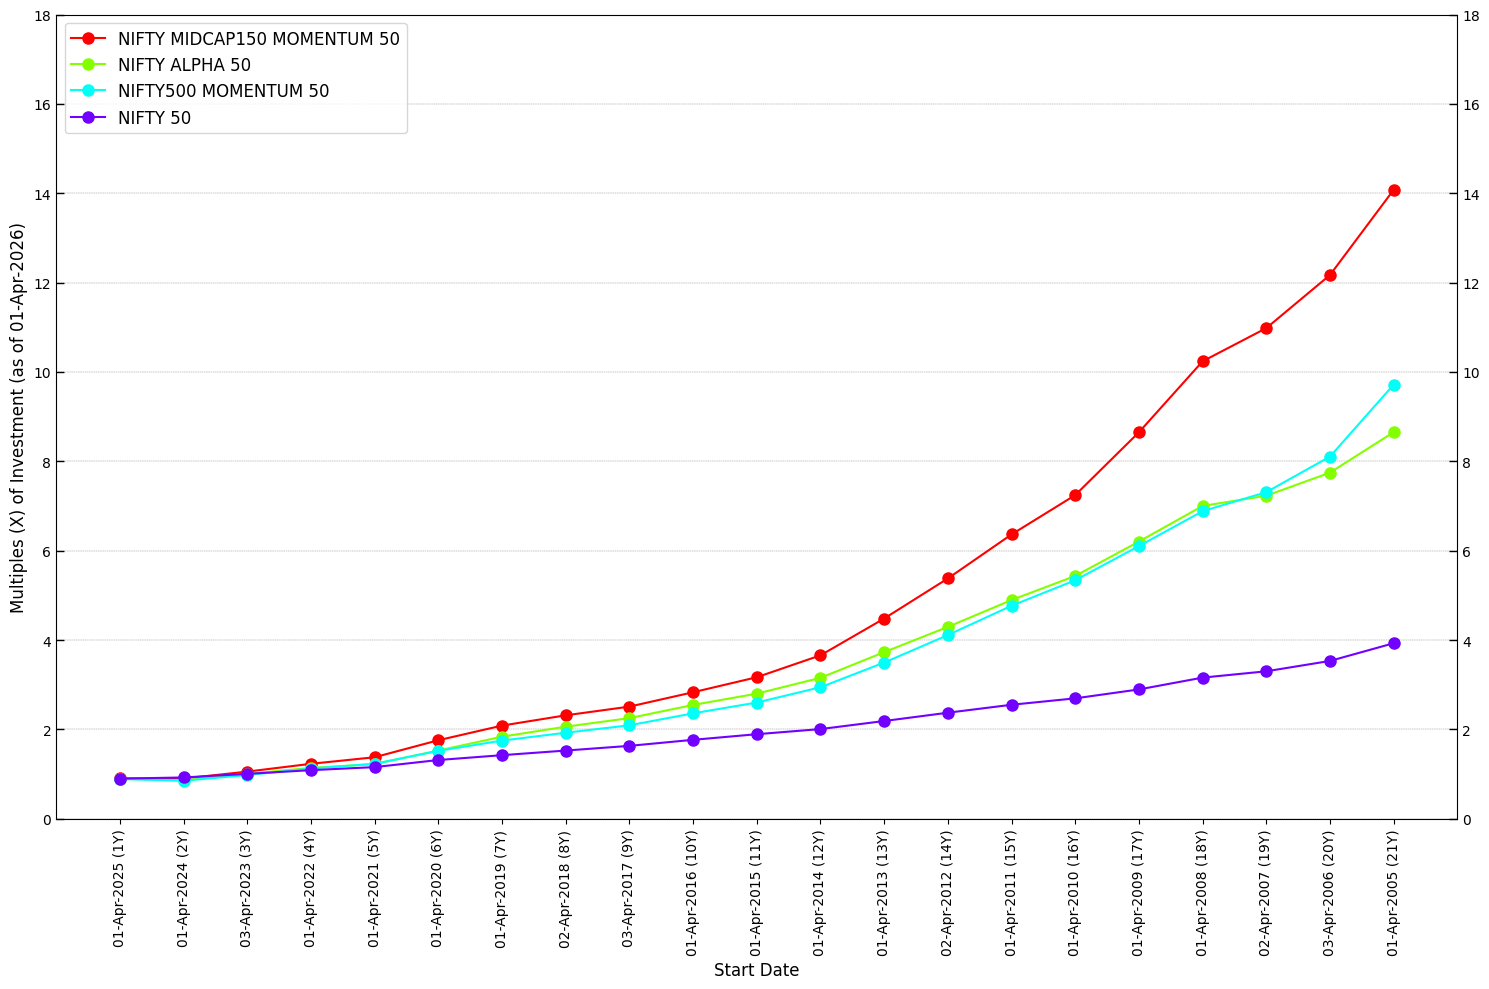
SIP Comparison Across Indices
This section presents a plot comparing the year-wise growth multiples (X) of a monthly SIP investment across assets.
visual.compare_performance(
    excel_file=r"C:\Users\Username\Folder\compare_sip.xlsx",
    figure_file=r"C:\Users\Username\Folder\compare_sip.png"
)
The resulting plot will resemble the example shown below.